
Reason for including the load factor along with capacity in the UPS redundancy comparison table
Even with the same N+1 configuration, the load factor varies depending on device capacity and the number of units in operation. Compare the load factors for the normal, failure, and expansion phases in the same table.
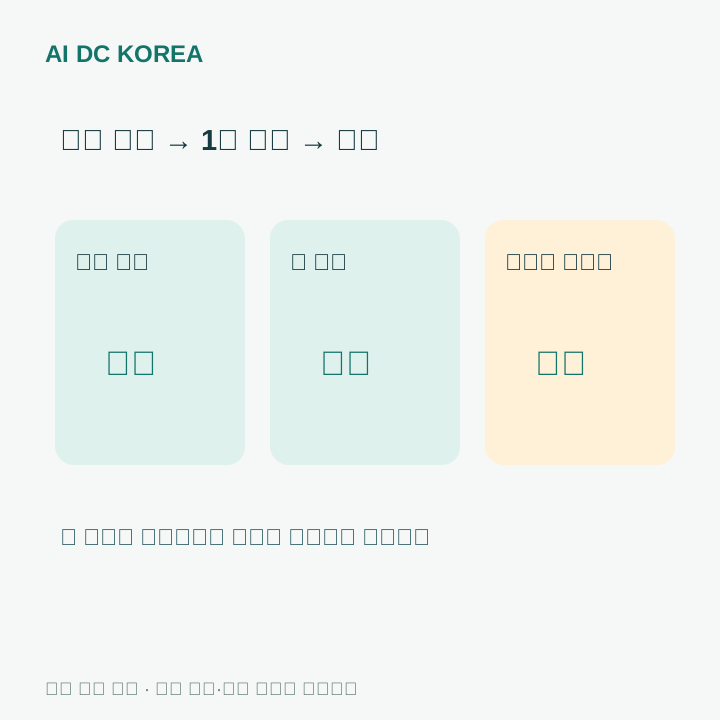
The operating points are not the same based solely on the N+1 notation.
Even if the notation “N+1” is the same, the actual operating conditions may differ. This is because the load factor handled by each UPS varies depending on the capacity per unit and the number of units in operation.
The comparison table is divided into three sections
The comparison table is divided into three scenarios: normal operation, one unit shut down, and final expansion. For each scenario, list the number of units in operation, total load, and load factor per unit.
Both efficiency and redundancy are recorded.
This allows you to view spare capacity and part-load efficiency in the same table. You should not focus solely on improving efficiency while reducing redundancy, nor should you justify excessive low-load operation on the grounds of redundancy.
To be verified again in the actual design.
The figures in this guide are specific design examples. Actual savings or availability in a project must be re-verified based on manufacturer curves, load fluctuations, and maintenance schedules.
Comparison table to be filled out manually
| Operational Scenes | Number of units in operation | Total Load | Load factor per unit |
|---|---|---|---|
| Normal Operation | ___ | ___ | ___ |
| 1 unit shut down | ___ | ___ | ___ |
| Final Expansion | ___ | ___ | ___ |
Blank fields indicate “unverified,” not “0” or “verified.”
If you have prepared the public materials, please begin the consultation.
Please provide the link to the original source, the reference date, and any questions you have. KakaoTalk support is available daily from 9:00 AM to 6:00 PM. Please note that opening the chat window is different from submitting an actual inquiry.